Today, we are fortunate to present a guest contribution written by Paweł Skrzypczyński, economist at the National Bank of Poland. The views expressed herein are those of the author and should not be attributed to the National Bank of Poland.
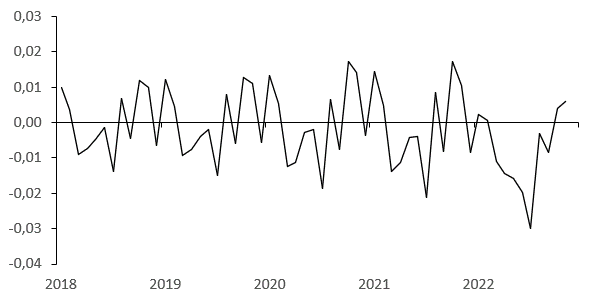
BLS releases “The Employment Situation – December 2022” and “Job Openings and Labor Turnover – November 2022” allow us to update the jobs-workers gap and the business cycle indicator based on it (previous posts: [1], [2]). As previously we assume that job openings level remains unchanged at the end of the sample (T) in comparison to the previous observation (T-1), due to the fact that JOLTS survey data availability lags the Household Survey data availability by one month. This update also incorporates revisions of seasonally adjusted Household Survey data published in “The Employment Situation – December 2022”. These revisions had a minor effect on the gap and hence the business cycle indicator – over 2018:01 – 2022:11 mean revision of the gap was only -3,2k (-0.002 pp).
Figure 1. Jobs-Workers Gap Revision (Percentage Points)
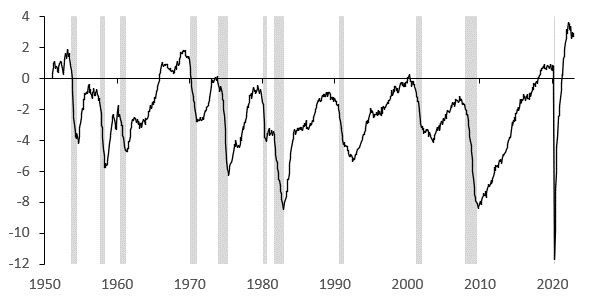
In December 2022 the jobs-workers gap was at 2.9% or 4.7 mn, up from November by 0.2 pp or 0.2 mn.
Figure 2. Jobs-Workers Gap (Percent)
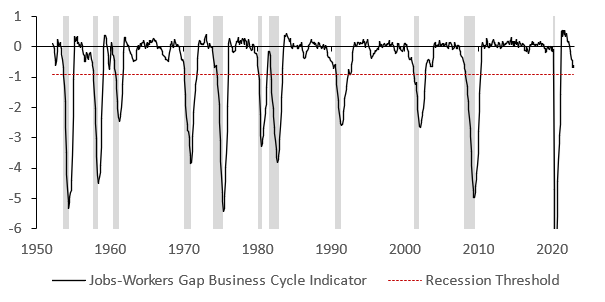
With this new data the jobs-workers gap business cycle indicator (JWGBCI) fell to -0.67 pp in December from -0.63 pp in November and remained above the recession threshold of -0.93 pp. In October the JWGBCI was also at -0.67 pp as in December. Recall the indicator uses a smoothed gap, namely we calculate the change of the three-month moving average of the jobs-workers gap relative to its maximum during previous twelve months.
Figure 3. Jobs-Workers Gap Business Cycle Indicator (Percentage Points)
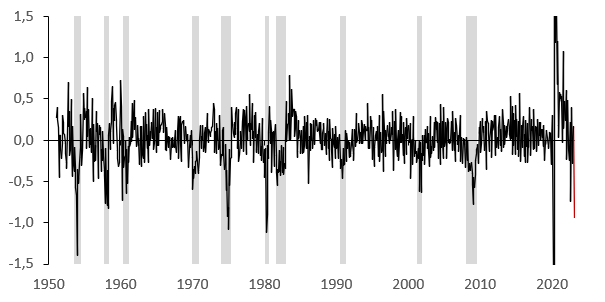
What magnitude of m/m change in the jobs-workers gap in January 2023 is needed to make a recession call? The jobs-workers gap (not smoothed) would need to collapse to 1.9% from 2.9% in December, that is 1 pp which corresponds to 2 standard deviations of historical volatility. Figure below presents this change (marked red) in historical perspective. Seems rather unlikely, as it would most likely mean quite deep contraction of employment or job openings, or both in m/m terms as of January.
Figure 4. Jobs-Workers Gap 1-Month Change (Percentage Points)
Conclusion: Recent readings of the gap and the business cycle indicator are in line with the labor market remaining resilient to fast tightening of monetary policy.
This post written by Paweł Skrzypczyński.


When I try to access the blog from my PC I get an error message that the connection is not private
Pgl: changed servers. Try using http:// instead of https://
attempting to be of service to the blog host here ~~~It’s been working much better than it was yesterday afternoon. I did get a similar warning yesterday, but with my comp it does work with https:// but I had to give it “permission” after the warning. Just to let you know (not a complaint, just an FYI), I don’t see the “lock symbol” on the left side of the browser address box.
No joke, James Kwak is super sharp on software, or knows people who are super-sharp on software, you might give him a buzz if this persists or you are perplexed. You are encouraged to omit this comment form your comments section. But if there’s a software issue I wouldn’t be too proud to phone James Kwak if I were you.
Moses Herzog: You have to use http:// instead of https://
Google brings up the version with https:// but it is easy just to erase that so it works. Crude but effective. Now if Google had AI, maybe it would do the right thing the first time.
I have some mixed feelings about this blog post. I always am excited and happy to see our good Polish friend Paweł Skrzypczyński jump upwards from the comments section to where his solid as a rock intellectual rigor belongs, the posts section of the blog. And I think nothing he says here is untrue, inaccurate, or misleading. I think he is largely correct that the official count of the jobs-workers gap has changed very little, or not enough to prove the Fed wrong at the moment. But I deeply fear the “latent” effect or “delayed”, or “lagged” (choose your preferred nomenclature) effect of the Fed tightening may prove them wrong or may prove them wrong very quickly if they don’t stop hitting the brakes at the next Fed rates decision time.
That’s one regular Joe’s opinion. But I still enjoyed the post and learned much from reading it.
Moses Herzog thank you. I share your view that the uncertainty in respect to how lagged effects of tightening play out is high. Unfortunately there are no episodes of this kind in history, that is supply-demand imbalance is huge, and in turn we are quite seriously blind when it comes to forecasting now (not that we were super precise in normal times… oh how I wish they come back). Nevertheless, the labor market, that does not show cracks at this point, and some other signals that Fed may be achieving it’s goal are encouraging. A good take on these imbalances I am mentioning is the recent speech by Lisa Cook of FRB: https://www.federalreserve.gov/newsevents/speech/files/cook20230106a.pdf.
Thank you for the reply Pawel, it means a lot to me , on personal level. We have to trust that they are “doing their best”, yes??? Sometimes I wonder the USA “Fed’s” intentions though, You know who I trust MORE than the USA Federal Reserve???? The good people of Poland, who are helping the women and children of Ukraine right now. WE LOVE YOU BROTHER
I don’t know what to say. Thank you!
Dr. Skrzypczyński
Using data from 2000m12 to 2022M12, for better understanding, I am trying to replicate your recession index as shown in Figure 2. Jobs-Workers Gap Business Cycle Indicator (Percentage Points) on the September 2, 2022 Econbrowser post. I don’t think I understand the calculation for Figure 2.
I computed a 3month moving average of the ratio points (JWGt/LF) tfrom Figure 1, found the maximum ratio point value for prior 12 months and divided the change in the 3-month moving average by the prior 12-month maximum ratio point value.
My Figure 1 looks like the Figure 1 in the post. For example, I compute a value of -0.117 for 2020M4.
Resulting values are not correct for Figure 2.
Any useful words for what appears to be a slow student in the class?
AS, as I understand you got to the point where you have the 3-month moving average of the gap, name this series Y_t for example. Next for month t calculate the indicator JWGBCI_t = Y_t – MAX(Y_t-1, Y_t-12), and you will arrive at the JWGBCI presented in the post. Since Y_t is scaled in % as the notsmoothed gap is, the JWGBCI_t is scaled in pp. Let me know if you have any further questions.
Thanks.
I may have correctly followed your instructions.
For 2002m02= -2.66%
For 2009m06 = -4.98%
For 2020m06 = -10.40%. If correct looks like the online graph was truncated.
For 2022m12 = -0.67%
If not correct, then looking like a remedial student.
AS, your calculations are correct and yes, the figure is truncated for 2020:06.
Fed tightening is a Volcker era political thing. What you really mean is interest carrying, which can force banks to increase loan volume and the desire for risk to churn profit.
Evidence that net inerest margins drive bank profits is not strong. For instance:
https://www.richmondfed.org/publications/research/economic_brief/2016/eb_16-05
Loan volume is a separate factor in bank profit, and is fairly strongly related to the pace of economic activity.
Fed tightening is clearly not a “Volcker era” thing. Volcker is gone and the Fed is tightening.
But nothing is tightening. It’s actually loosened the last few months. The Fed simply doesn’t matter that much outside of bank problems.
I know I’m changing the topic from this labor market measurement debate but Alan Blinder has some wise observations on inflation (noted over at Kevin Drum’s blog):
https://www.wsj.com/articles/inflation-sudden-drop-12-5-month-cpi-pce-energy-food-new-year-price-federal-reserve-11672914903?st=kk5jyw57m1emws4&reflink=desktopwebshare_permalink
Maybe we should start the new year with some good news: Inflation has fallen dramatically. No, that’s not a prediction; it’s a fact. With one month remaining in 2022 (in terms of available data), inflation in the second half of the year has run vastly lower than in the first half. In fact—and this is astonishing—it’s almost back down to the Federal Reserve’s 2% target. Even more astonishing, hardly anyone seems to have noticed. Yes, there’s a catch or two or three, to which I’ll come back. But first the good news: Over the past five months (June to November 2022), inflation has slowed to a crawl. Whether measured by the consumer-price index, or CPI, which most people watch, or the price index for personal consumption expenditures, or PCE, which the Federal Reserve prefers, the annualized inflation rate has been around 2.5% over these five months.
Permit me to interrupt the excellent Dr. Blinder to note anyone reading this blog noticed. So did the readers of Kevin Drum’s blog. Kevin suggesting that anyone who did not notice is a moron. But Dr. Blinder continued:
Yes, you read that right. Yet hardly anyone has noticed this stunning development because of the near-universal concentration on price changes measured over 12-month periods, which are still 7.1% for CPI inflation and 5.5% for PCE inflation. Normally, focusing on 12-month inflation rates is the right thing to do, for two main reasons. First, it guards against hyperventilation over “blips” in the inflation data, whether up or down. Second, it obviates the need for seasonal adjustment, since, for example, you are comparing prices in November 2022 with those in November 2021. But when the inflation rate changes abruptly, 12-month averages can leave you watching recent history rather than current events. Today is one of those times.
So well said that you would think the morons who run the press might stop their obsession with 12-month inflation rates. Now to be fair – our press is not nearly as pathetic as Bruce Hall who tried to tell us that inflation was 13.3% by: (a) using a 17-month period as if it were a year; (b) defining this 17-month period as ending as of June 2022 not December 2022; and (c) relying on a source that cannot be bothered to use seasonally adjusted data. Now maybe Kevin would call Bruce Hall a moron but we all know his a professional liar.
pick your poison.
year on year vs month on month.
I suggest month on month is similar to acceleration, discrete changes, versus longer term year on difference.
for most part recent month on month in cpi and pce index show slowing acceleration.
whether slow or fast….
not that inferring calculus is a good plan
I have so much affection towards Alan Blinder, the same category of affection I have mentioned I have to Krugman, James Kwak, Menzie Chinn, I have to Alan Blinder, who else?? Schumpeter?? David Ricardo??? Thanks for the heads up on the WSJ editorial my friend!!!!!
LOL! So, you still haven’t figured out how to calculate inflation from a point in time? While you may be in the throes of convention rigor mortis, there is more than one way to examine change. Here’s a hint: daily, monthly, annual, cumulative; you adhere to the proposition that only monthly and annual can be used. Take a lesson from climate analysis which compares current to various points in time. Or from weather analysis which compares information daily, annually, or historical highs and lows.
Keep attempting to be snarky, but it only demonstrates adolescent foolishness.
“you still haven’t figured out how to calculate inflation from a point in time?”
Such a retarded comment from the troll who still does not know the difference between the price-level and the rate of change in the price level. Hey Brucie boy – Blinder co-authored this economics textbook with William Baumol:
https://www.amazon.com/Economics-Principles-William-J-Baumol/dp/1305280598
We would suggest you READ it but then it is WAY over your head.
Bruce Hall’s typical retarded comment reminded me to link to Kevin Drum:
https://jabberwocking.com/an-economist-tells-us-to-listen-up-inflation-is-now-low/
‘This is a good opportunity to get something off my chest: Anyone who didn’t notice this stunning development is an idiot. Or maybe a visceral inflation hawk who needs to be put out to pasture. If you spent the past year obsessed with year-over-year figures just because those are the ones we usually use in normal times, you should not be allowed anywhere near monetary policy. Please return to the 1970s where your brain is apparently stuck permanently.’
I picked this particular paragraph to highlight as it references Brucie Boy. Yea Brucie is an idiot, he needs to be put out to pasture, and has a teeny little brain permanently stuck in the 1970s. And that is his better qualities. ,
The women in our profession are speaking up:
https://fortune.com/2023/01/09/us-economists-in-arms-cesspool-hiring-website-sexual-harassment-bullying/
At this year’s meeting in New Orleans of the American Economic Association, the field’s largest professional organization, a group of mostly female economists urged it to take steps to help take down the independent website that AEA President Christina Romer referred to as a “cesspool.” “We have got to do something and silence, I believe, is not an option,” said Martha Olney, a professor emerita at the University of California, Berkeley.
The comments, made during a panel convened to discuss harassment issues, were met with applause. The website, Economics Job Market Rumors, hosted by an unknown individual and allowing users to post anonymously, started out as a place for economists to share information about hiring activity in the field in 2008, before Twitter was widely used. It has since become a venue to showcase the darkest aspects of the profession’s culture, a place where egregious commentary can be aired with little consequence.
Economics Job Market Rumors started off as a good idea but the person who runs it allows way too much trash to be put up. This is an issue that that been a while for a long time so it is good that those at the AEA meetings have taken this on.
pgl,
I planned to attend ASSA, but did not due to illness.
EJMR has been toxic from its begining and has been publicly denounced by AEA before on several occasions. But it is not going away.
I have long kept an eye on it as I was publicly denounced on it at length several times for several matters. As it is I have tried to help people there by giving useful advice on such matters as dealing with journal editors.
The recent event I have not seen commented on here but did there has been the passing of the greatest mensch of the economics profession, Herb Gintis. I have been part of discussions of him on Econospeak and Facebook.
I was extremely sad to hear about Herb Gintis’s passing away. Which I was informed about on your blog. I was/am very sad about that, A scholarly man, with many contributions to the conversation, similar to yourself.
My prayers and thoughts are with Professor Gintis’s family now.
Anyone who likes good music, and recognizes the great contributions of the Jewish people to America, I encourage you to do a search on Youtube for this:
“Itzhak Perlman Performs A Two-Song Medley With Jon Batiste”
Both parts are good, but for the record, I prefer the first half, first part, of the two song medley
I generally do not believe in the young people’s use/meaning of the word “toxic”. But I think in the case of “EJMR” it is most likely true.
euro journal on med research?
Lord – you are dumber than a rock. But still brighter than Bruce Hall.
tx
The House under the “leadership” of Kevin McCarthy says it wants to balance the budget by making sure the rich do not pay taxes!
https://jabberwocking.com/first-republican-act-of-the-new-congress-is-to-blow-up-the-deficit/
First Republican act of the new Congress is to blow up the deficit
The real name of the bill is the Family and Small Business Taxpayer Protection Act. Because why not? Republicans can call it anything they want regardless of what it actually does. And what it does is simple: It repeals the Democratic bill from last year that gives the IRS more money for taxpayer services and high-income audits. By defunding taxpayer services it will keep people mad at the IRS. By defunding the IRS, audits on the rich will continue to go down and that will be a boon for wealthy Republican donors.
Kevin has all sorts of graphs and commentary. But of course Bruce Hall will mansplain to us how this will lower inflation. MAGA!
Is it 88 million infected in a single province or just 120,000 in all of China since they stopped “zero Covid”?
https://www.bbc.com/news/world-asia-china-64208127
Very hard to find out what is really going on with Covid in China.
The Washington Post is trying to help:
https://www.washingtonpost.com/investigations/2023/01/09/china-crematorium-covid-deaths/
Xi Jinping= high officials trying whatever move they equate with job security= ill informed insanity
That’s one white dude’s opinion who spent seven years there.
https://www.worldometers.info/coronavirus/
January 10, 2023
a ) There were 5,226 coronavirus deaths in China on May 26, 2022.
b ) There were no coronavirus deaths from May 26, for nearly 6 months, through November 19.
c ) From November 20 through January 9, 2023 there have been 46 coronavirus deaths in China, bringing the total from 5,226 to 5,272.
d ) During the nearly 6 months of no coronavirus deaths in China, there were 300 to 500 coronavirus deaths each day in the United States.
e ) Coronavirus deaths in the United States continue at 250 to 450 each day.
f ) There have been 1,121,298 coronavirus deaths in the United States through January 9, 2023.
https://www.worldometers.info/coronavirus/
January 9, 2023
Coronavirus
United States
Deaths ( 1,121,298)
Deaths per million ( 3,349)
China
Deaths ( 5,272)
Deaths per million ( 3.6)
https://www.worldometers.info/coronavirus/
January 9, 2023
Coronavirus
Germany
Deaths ( 162,975)
Deaths per million ( 1,943)
China
Deaths ( 5,272)
Deaths per million ( 3.6)
https://www.aap.org/en/pages/2019-novel-coronavirus-covid-19-infections/children-and-covid-19-state-level-data-report/
January 9, 2023
Cumulative Number of Child COVID-19 Cases
As of January 5, over 15.2 million children are reported to have tested positive for COVID-19 since the onset of the pandemic according to available state reports. About 162,000 of these cases have been added in the past 4 weeks. This week almost 31,200 child COVID-19 cases were reported. This is a small decrease from the previous week, but likely an undercount that increased during the holidays, for example some states had not updated data on their web sites at the time of this analysis.
15,239,453 total child COVID-19 cases reported, and children represented 18.1% (15,239,453 / 84,123,431) of all cases
Overall rate: 20,247 cases per 100,000 children in the population
American Academy of Pediatrics
Children’s Hospital Association
The fight to get McCarthy enough votes to become the most worthless Speaker of the House ever was more ugly than we thought:
https://www.rawstory.com/republican-donors/
Rebellious Republicans who withheld their votes from House Speaker Kevin McCarthy (R-CA) for multiple days last week were directly pressured by a major GOP donor to back off or see their campaign contributions go up in smoke. As reported by Politico’s Olivia Beavers, at least two Republicans got what she describes as a “direct threat” from Hungarian-born American businessman Thomas Peterffy to fall in line with the other Republicans. In fact, one source shared a screenshot of a message Peterffy sent to one member that read, “What goes on in the House is weakening the party, unless you vote for Kevin now we’ll never give you any money.” As noted by Audrey Fahlberg, a reported for The Dispatch, Peterffy this past fall donated $5 million to the Congressional Leadership Fund, a McCarthy-aligned organization that had come under fire from the right-wing Club for Growth for interfering in Republican primaries in safe Republican districts.
Hungarians and the Club for Rich People feuding over little Kevin. Donald Trump’s Republican Party is more than mob gangs dueling with each other.
Off topic, war-gaming of China’s invasion of Taiwan,
The results aren’t good. Running several scenarios all result in Taiwan remaining independent of China, but at a terrible cost to Taiwan, China and the U.S.:
https://www.csis.org/analysis/first-battle-next-war-wargaming-chinese-invasion-taiwan
One conclusion is that greater deterence is needed to assure either no attack on Taiwan or a more decisive victory over China in order to reduce losses.
A further conclusion is that China’s communist regime might be destabilized. This seems to me a more credible conclusion than, for instance, that a change in Covid rules would overturn China’s regime.
There are an increasing number of reports like this one which show that the U.S. is increasing it’s deterence against Chinese aggression in Asian waters:
https://news.usni.org/2022/11/02/navy-expanding-attack-submarine-presence-on-guam-as-a-hedge-against-growing-chinese-fleet
What the authors of the CSIS report apparently have in mind, however, is a more rapid and expensive increase in U.S. military capacity in defense of Taiwan.
The arms race between the U.S. and U.S.S.R is often given a large share of the credit in bringing the U.S.S.R. down. I have a couple of reservations if that is used as an analogy in the U.S./China rivalry, perhaps lurking in the minds of some U.S. military analysts. First, I think too much credit is often given to the arms race, too little to economic and social factors. Second, China’s economy is on rocky ground now, but that’s partly cyclical; the Soviet Union had massive economic problems which were largely structural. China can probably sustain an arms race more easily than the U.S.S.R.
An arms race is bad for all, and looking more or less baked in the cake.
Katie Porter is warming up for a Senate run:
https://www.politico.com/news/2023/01/10/katie-porter-senate-campaign-feinstein-00077210
The Senate is where Congressional brains usually end up.
The exception that proves th rule: Ted Cruz.
Well Lindsey Graham made it to the Senate joining Cruz in the peanut gallery.